
Welcome, dear reader, to a serious look at something that often causes a little bit of confusion in the world of statistics and data analysis: how to find the P-Value in Excel. It sounds quite scary, a p-value, all official and mathematical, but really, it is not so terrible when you get right down to it. We are speaking about this idea called hypothesis testing, and that little step is truly the core of how scientists investigate things and how businesses try out new ideas and experiments. When you want to calculate p value for a critical business experiment or academic study, Excel is a perfectly good place to begin your journey.
The P-Value in Excel, in simple terms, is a measure of how likely you are to have observed a result as extreme as, or more extreme than, the one you actually did observe, assuming that the null hypothesis is totally true. If the P-Value in Excel that you calculate p value for is tiny, it means the observed result is very unlikely to be random coincidence, suggesting you should reject the null hypothesis. Many people wrestle with the theory, but the actual steps to find the P-Value in Excel are actually quite straightforward once you know the tricks and the proper formulae.
Getting Ready: Setting up for P-Value in Excel
Enabling the analysis toolpak is one of those helpful excel add-ins that somehow gets overlooked, but it is totally essential for performing proper statistical analyses, including running a t-test and finding the P-Value in Excel. So, to grab this really essential tool, here is how you normally do it: you need to poke around a bit. You generally go up to the “File” tab at the top, then look for “Options,” and then you should see “Add-ins.” When you get there, just pick the analysis toolpak right off the list of those excel add ins. It’s usually a pretty quick thing to do. Make sure you check the box and click OK. Do not worry if you have never done this before; it is a quick one-time process, and once you have activated the analysis toolpak, you will find it sitting nicely under the “Data” tab, ready to help you calculate p value. These excel add ins are powerful tools that extend Excel’s capability into proper statistical computing, making the task of determining the P-Value in Excel much simpler than doing it all manually. You will be using the analysis toolpak quite a lot.
Method One: Utilizing the T.TEST Function to Calculate P-Value in Excel
For many common comparative tests, there is a very direct way to find the P-Value in Excel, and that is by using the T.TEST function. This is considered one of the most useful advanced excel functions because it takes the complexity out of comparing two samples, giving you the P-Value in Excel directly, and saving a great deal of time. If you have some excel data for practice that compares the average performance of two groups, such as sales figures from two different marketing campaigns, then the T.TEST function is exactly what you need. When you employ the T.TEST function, you are asking Excel to calculate p value for the difference between the means of your two data sets.
Understanding the T.TEST Function Arguments
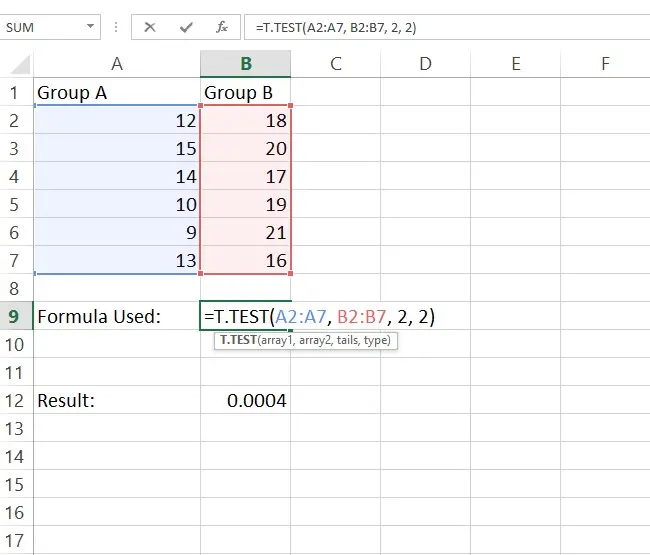
The syntax for the T.TEST function is deceptively simple, but you must know what the parts mean to calculate p value correctly:
=T.TEST(array1, array2, tails, type).
Array1 and Array2 are your excel data for practice ranges, the two sets of observations you wish to compare.
Tails specifies if your test is one-tailed (1) or two-tailed (2). This choice affects the resulting P-Value in Excel.
The Type part of the formula is where you tell Excel exactly which flavor of t-test you want to run. You pick a 1 for a paired test, maybe a 2 if you think both groups are pretty much the same in terms of scatter, or a 3 for when they are all different and have unequal variances. Getting the correct type is super important, like really paramount, because if you mess that up, the final P-Value you get in Excel just is not going to be reliable, and that would be a right shame, would not it? You can also use specialized excel add ins for this purpose.
If you have some proper excel data for practice ready to go, the implementation of the T.TEST function is merely a matter of selecting the correct cell ranges and choosing the appropriate parameters. This function is one of those advanced excel functions that, once mastered, becomes a staple in your data analysis routine, making it quick work to calculate p value. The beauty of using the T.TEST function is its speed in giving you the final P-Value in Excel.
Method Two: Calculating P-Value in Excel using Data Analysis
Another superb approach to find the P-Value in Excel is by using the analysis toolpak that we talked about activating earlier. This method is often preferred when you want to see a comprehensive statistical output, not just the single P-Value in Excel. Using the analysis toolpak is another fantastic example of advanced excel functions at work.
Running a t-Test with the Analysis Toolpak
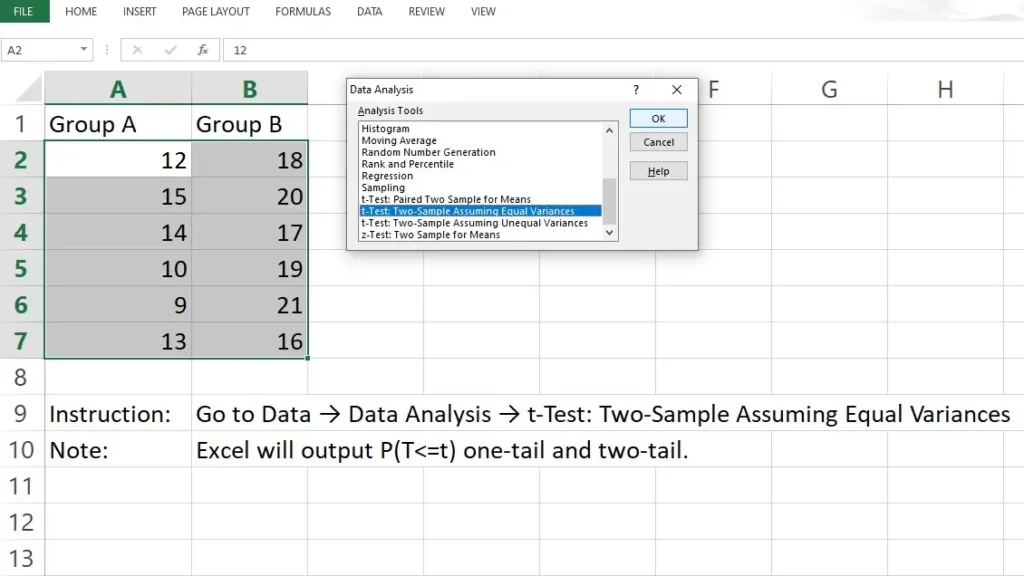
Once you have the analysis toolpak ready, you click “Data Analysis” under the “Data” tab. Once you have that Data Analysis button clicked, a big box is going to pop right up and show you a whole lot of tests. You just have to scroll down and pick the right t-Test for what you’re doing, like for example, the one called “t-Test: Two-Sample Assuming Equal Variances”. It’s easy enough to find what you need there. You input your two excel data for practice ranges, define your hypothesized mean difference (often 0), and then the output will appear in a new sheet, presenting a wealth of information, including the crucial P-Value in Excel. This output is very useful as it shows the actual calculated test value and the critical test value alongside the p-value. The output is where you find the P(T<=t) one-tail and P(T<=t) two-tail values, which are the P-Value in Excel you are looking for. Observing the test value and comparing it to the critical test value is a fundamental step in hypothesis testing, and the analysis toolpak makes this process incredibly transparent. Getting all these results from the analysis toolpak is much better for documentation, even if you are just using simple excel data for practice. Specialized excel add ins can also be used to generate these results.
Finding the P-Value from a Z-Score in Excel
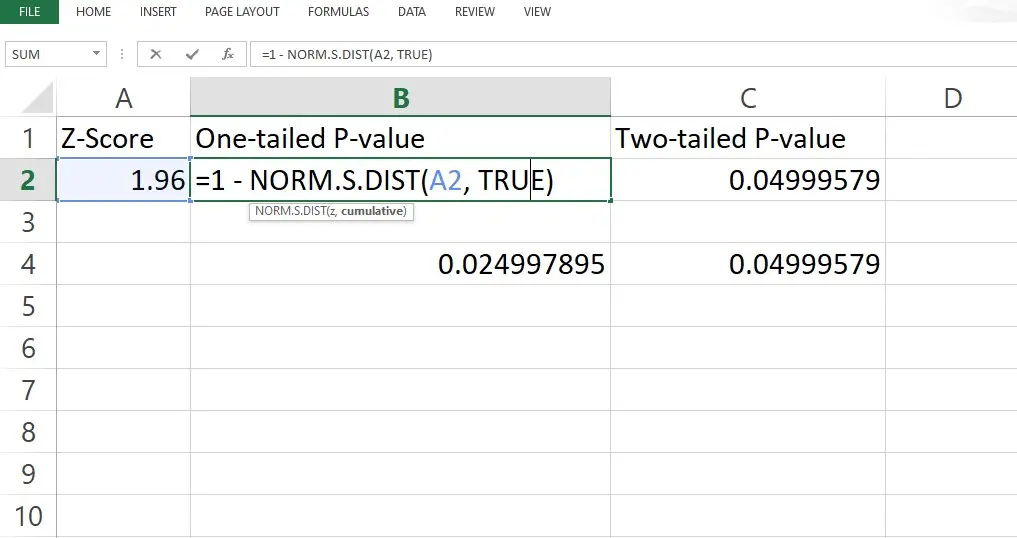
Sometimes, you are mucking around with data, and you might know the true spread of the whole entire group of people or things, which is what we call the population standard deviation. Or maybe you just have a really large sample size, a massive amount of data points. You can absolutely still calculate p value from your computed Z-score right in Excel using one of the advanced excel functions, namely the NORMSDIST or NORM.S.DIST function. First, you must have your calculated test value (the Z-score). Then, the NORM.S.DIST function, which is one of the important advanced excel functions, gives you the cumulative probability for a standard normal distribution up to that Z-score.
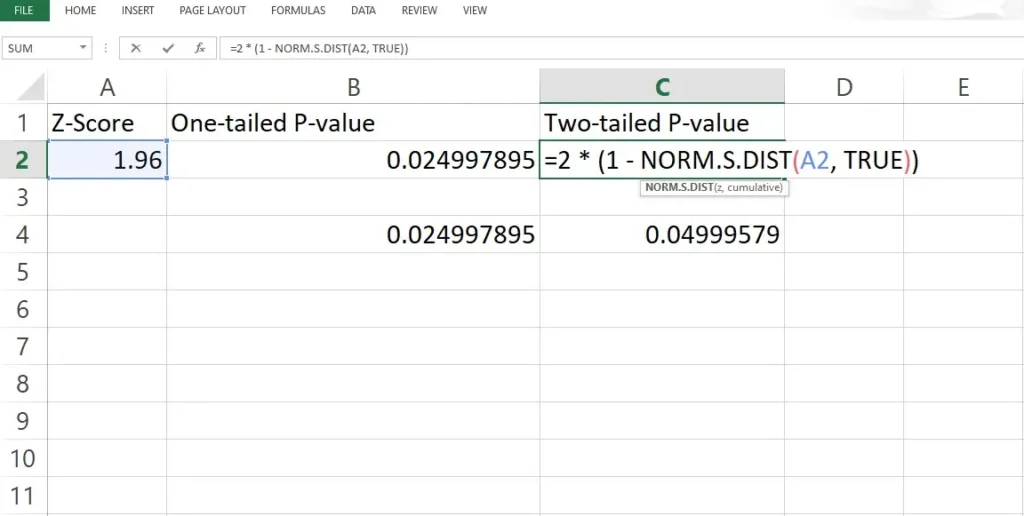
The resulting probability is not the final P-Value in Excel yet, but it gets you very close. If it is a one-tailed test, you simply subtract that cumulative probability from 1 to find the P-Value in Excel (for the upper tail), or use the resulting probability directly (for the lower tail). If it is a two-tailed test, you must double the result of the single-tail calculation. This manual calculation helps you understand the concept of a test value and how it relates to the P-Value in Excel and is a neat exercise with advanced excel functions. Remember, every step in getting to the final P-Value in Excel depends on knowing the difference between a one-tailed and two-tailed test.
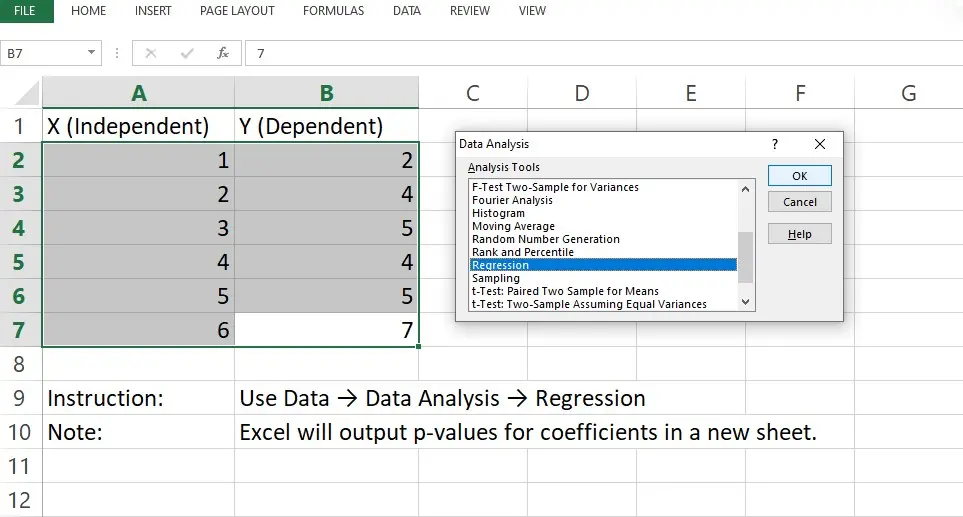
P-Value in Excel for Regression Analysis
Moving on to more sophisticated statistical work, like predicting outcomes using multiple variables, we find the P-Value in Excel showing up in regression analysis excel. This is where the power of advanced excel functions really shines. When you run a linear regression analysis excel, the output, which again you can generate using the analysis toolpak, provides a p-value for each of the predictor variables, or coefficients, in your model. The individual P-Value in Excel for each coefficient tells you if that specific variable is significantly contributing to the model’s prediction.Now, if that P-Value in Excel that goes with a specific variable turns out to be quite high, that means we simply cannot ditch the idea, which is the null hypothesis, that the true number for that variable’s effect (its coefficient) is actually zero. And what that really boils down to, in plain talk, is that this variable is not doing a good enough job of explaining all the changes and shifts we see in the dependent variable. Mastering regression analysis excel and the interpretation of these multiple p-values is a necessary step for anyone performing predictive modeling. Even with complex excel data for practice, the regression analysis excel feature produces results in a clear format so you can assess the statistical significance of every variable. We use the P-Value in Excel from this regression analysis excel to decide what variables we keep in our model.
Interpreting Your P-Value in Excel
Regardless of whether you used the T.TEST function, the analysis toolpak, or a manual Z-score approach to calculate p value, the interpretation remains exactly the same. The P-Value is compared against a pre-chosen significance level, denoted as alpha (\alpha), which is typically set at 0.05. If the P-Value in Excel is less than or equal to 0.05, we say the result is “statistically significant” and we reject the null hypothesis. That small P-Value in Excel suggests your observation is unlikely to be random chance. If the P-Value in Excel is greater than 0.05, we fail to reject the null hypothesis.It’s really important to remember a key point here: when we say we fail to reject the null hypothesis, that doesn’t at all mean we’re accepting it as totally true. No, siree. It just means that we hadn’t collected enough proof, or enough strong evidence, to truly show there was a significant effect going on. Sometimes, if you end up with a big P-Value in Excel, that’s just a friendly tap on the shoulder saying you should probably go find a bunch more excel data for practice and try again.
Learning to determine the P-Value in Excel
It is an amazing step forward in your data analysis journey. Whether you are using the precise T.TEST function or the more robust analysis toolpak, or even if you are deeply involved in regression analysis excel, the goal is always the same: to confidently calculate p value and make data-driven decisions. The ability to find the P-Value in Excel using various methods, including the T.TEST function and other advanced excel functions, makes this spreadsheet program a powerhouse for quick statistical testing. You can practice with your own datasets, using the steps we have described, and watch as the mystery of the P-Value in Excel disappears entirely. Do not be afraid of the test value or the critical test value; they are simply milestones on your way to obtaining the key insight provided by the P-Value in Excel. We have learned how to activate the excel add ins we need, how to utilize the T.TEST function, and how the analysis toolpak works. Getting the correct P-Value in Excel starts with choosing the right method for your excel data for practice. Once you can find the P-Value in Excel reliably, you possess a fundamental skill.
Conclusion
Mastering how to find the P-Value in Excel is more than just learning another statistical trick — it’s a major step toward making clearer, more confident, and more evidence-based decisions. Whether you prefer using the T.TEST function, the analysis toolpak, or regression outputs, each method gives you the ability to calculate p value with precision and understand what your results truly mean. The more you experiment with your own datasets, the more intuitive the process becomes, so take a moment to run a quick test yourself and see how each method behaves. As you continue practising, try applying these techniques to real business or academic scenarios, and you’ll quickly notice how much stronger your analysis becomes. Go ahead — open Excel, run a few tests, and let the P-Value guide your next data-driven decision.